
As the US enters an era of intense trade negotiations and revisits its tariff agreements with other countries, the business sector needs to stay informed. Even if a company might not be part of a sector that is directly affected by the new regulations, it can still feel the burden down the line. A tariff levied on a raw material such as aluminum can stress manufacturers using the metal as part of the construction of their products, as well as downstream companies providing products and services tied to those products.
“Given the increasingly overlapping major trends that are impacting globalization (tariffs, geopolitics, climate), it is important to have actionable visibility into location, environmental performance and production of key inputs,” says Malcolm Harris, EVP, Corporate Strategy and Partnerships at RS Metrics. “Location will determine whether the commodity is likely subject to tariffs and geopolitical impacts like China’s recent ban on exports of rare earths. Environmental performance can highlight risk of supply disruption due to environmental impacts (landslides, erosion) and potential carbon pricing impacts on price. Real-time monitoring can track production numbers that drive commodity pricing. These overlapping analyses provide foundational data to assess exposure to tariffs and related risks to supply and price.”
So what should companies do to better prepare? RS Metrics is currently part of WEF’s Trade Compliance Practitioners within their Centre for Regions, Trade and Geopolitics and we have been sharing our insights on how corporates can use geospatial data to avoid disruption of their work processes. See below a few strategies for success…
History Repeats Itself
This is far from the first time that the US has experienced a trade conflict with other countries. During Trump’s first mandate, in 2018, he introduced 25% tariffs on copper and 10% tariffs on aluminum imports from China. This resulted in an increase in domestic production of the metals but also in a strain for industries using those metals as a key part of their production processes (Source). With an in-depth understanding of the production and activity levels in the metals and mining sector, RS Metrics was able to provide insightful analytics through its MetalSignals product about the movement of metals and the implications it might have for the Purchasing Managers’ Index for the country (see graph below). We also looked at stock levels of aluminum at the port of Trieste, establishing an increase from the amount of metal stored there from December 2018 to April 2019, demonstrating potential for different types of purchasing contracts (Source). Now, RS Metrics is ready to bring the same analytical approach through its Custom Event-Driven Monitoring (CEDM) tool to help corporates estimate the production and activity levels at main metals and mining companies like BHP, Rio Tinto, and Alcoa.

Influence on the Finance Sector
It is not only manufacturers that should be paying attention to tariffs. Investors should also explore how the adjustments might be influencing their decisions as well. For them, it is important to know which companies might be increasing production or shifting their focus on other trade engagements.
“Tariffs can significantly impact a company’s cost structure, competitive positioning, and ultimately its profitability,” says Magnus Billing, President of RS Metrics Europe. “In an era of tariffs, an investment analysis should use reliable and verified data to evaluate how corporates are able to mitigate and adopt their business models to navigate the tariff landscape.”

How Asset-Level Data Can Help
RS Metrics provides asset-level data. This means that instead of supplying information about a company only as a whole, we give you insights for every individual facility so you can know the performance and any particular advantages or disadvantages associated with that asset. The data science team recognized the immense value of this analytical approach, enhancing the data even further and making it available through Google Cloud Marketplace here for subsequent integration with tools like BigQuery, Vertex AI Workbench, Kubernetes Applications, GEE, and Looker Studio.
“Companies facing shifting trade dynamics need more than generic market commentary; they need timely, asset-specific intelligence that connects trade policy to real operational and financial outcomes,” explains Rashmi Bomiriya, PhD, COO and Chief Data Scientist at RS Metrics. “That’s exactly where RS Metrics brings a strategic edge.”
By mapping ownership, location, and activity levels of key facilities across sectors such as metals, manufacturing, and logistics, RS Metrics enables decision-makers to identify which assets are most exposed to tariff impacts whether due to their geographical placement, environmental risk profile, or their position within the supply chain. This visibility helps companies anticipate and respond to shifting cost structures, supply constraints, and sourcing risks with speed and precision.
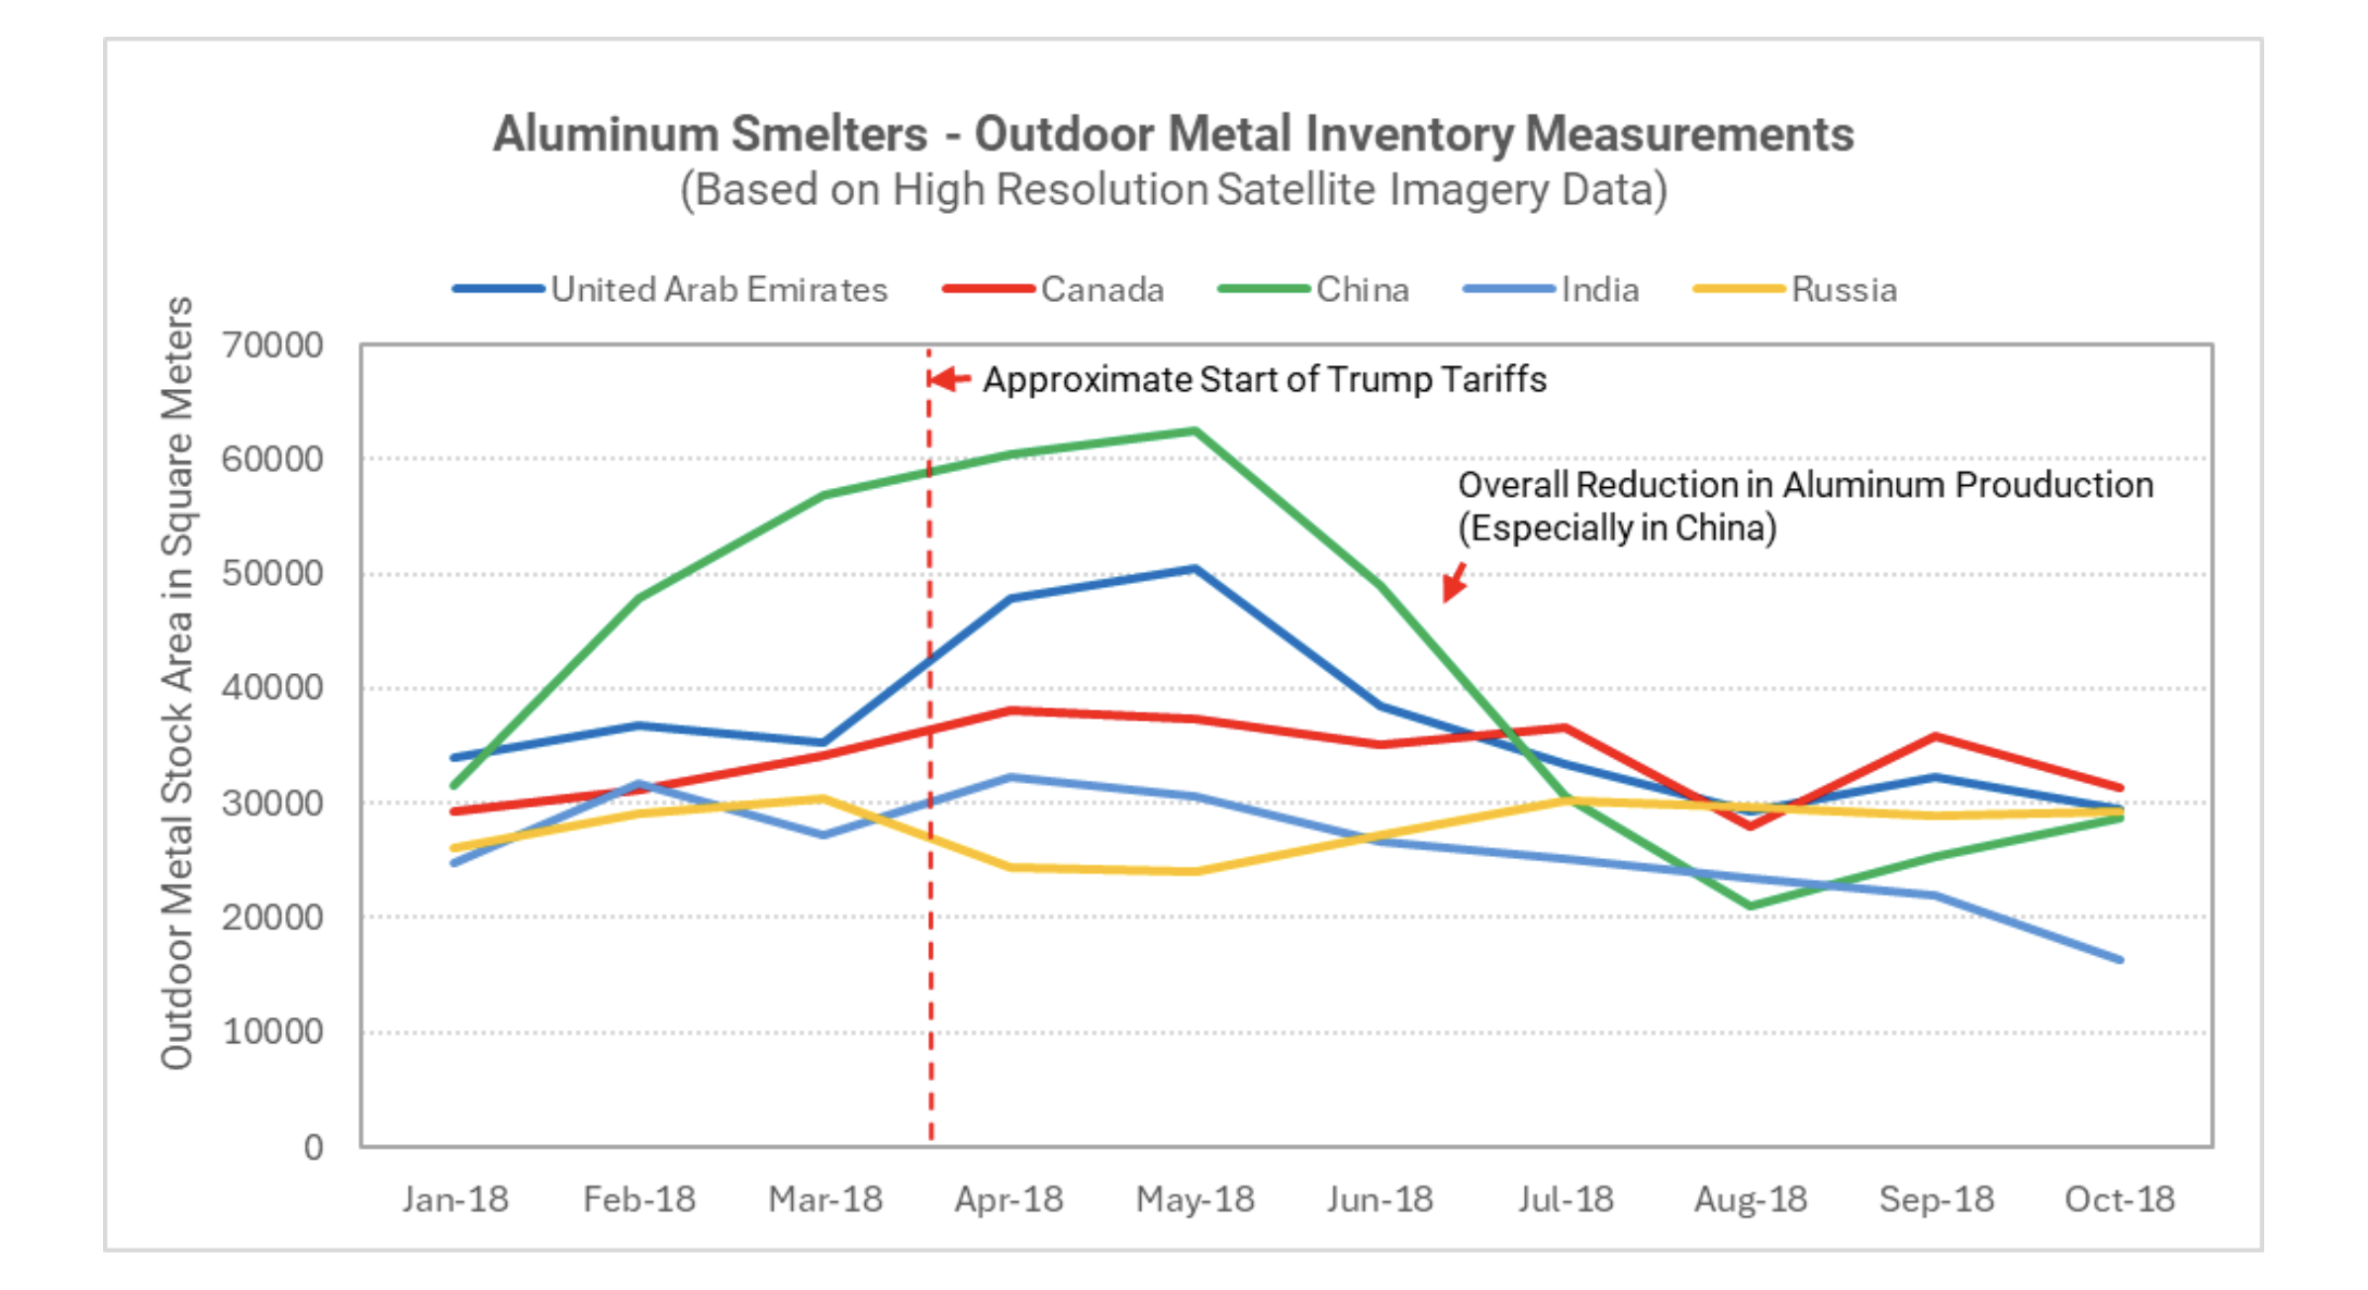
One powerful example is our monitoring of outdoor aluminum inventories at major global smelters during the 2018 U.S. tariff wave. The satellite-based analysis, visualized below, revealed an immediate buildup in inventory levels; particularly in China, UAE and Canada followed by a significant decline, especially in Chinese production. These insights helped our clients assess trade policy responses in real time and adapt procurement and investment strategies accordingly.
All in all, while it is impossible to stay away from all the noise created by the new tariffs, companies can obtain reliable and objective data to resume their processes with minimal disruptions. Quality information continues to be one of the best ways to address trade-related issues. And RS Metrics is here to provide it for you in any shape or form that makes sense for your business at this time.
This piece was written by the RS Metrics team and contains insights from Malcom Harris, EVP, Corporate Strategy and Partnerships at RS Metrics, Magnus Billing, President of RS Metrics – Europe, and Rashmi Bomiriya, PhD, COO and Chief Data Scientist at RS Metrics.


