
RS Metrics is the first company to take a quantitative approach to analyzing satellite imagery on a large scale for the investment community. We have clients from various investment styles and many are quantitative investors like you.
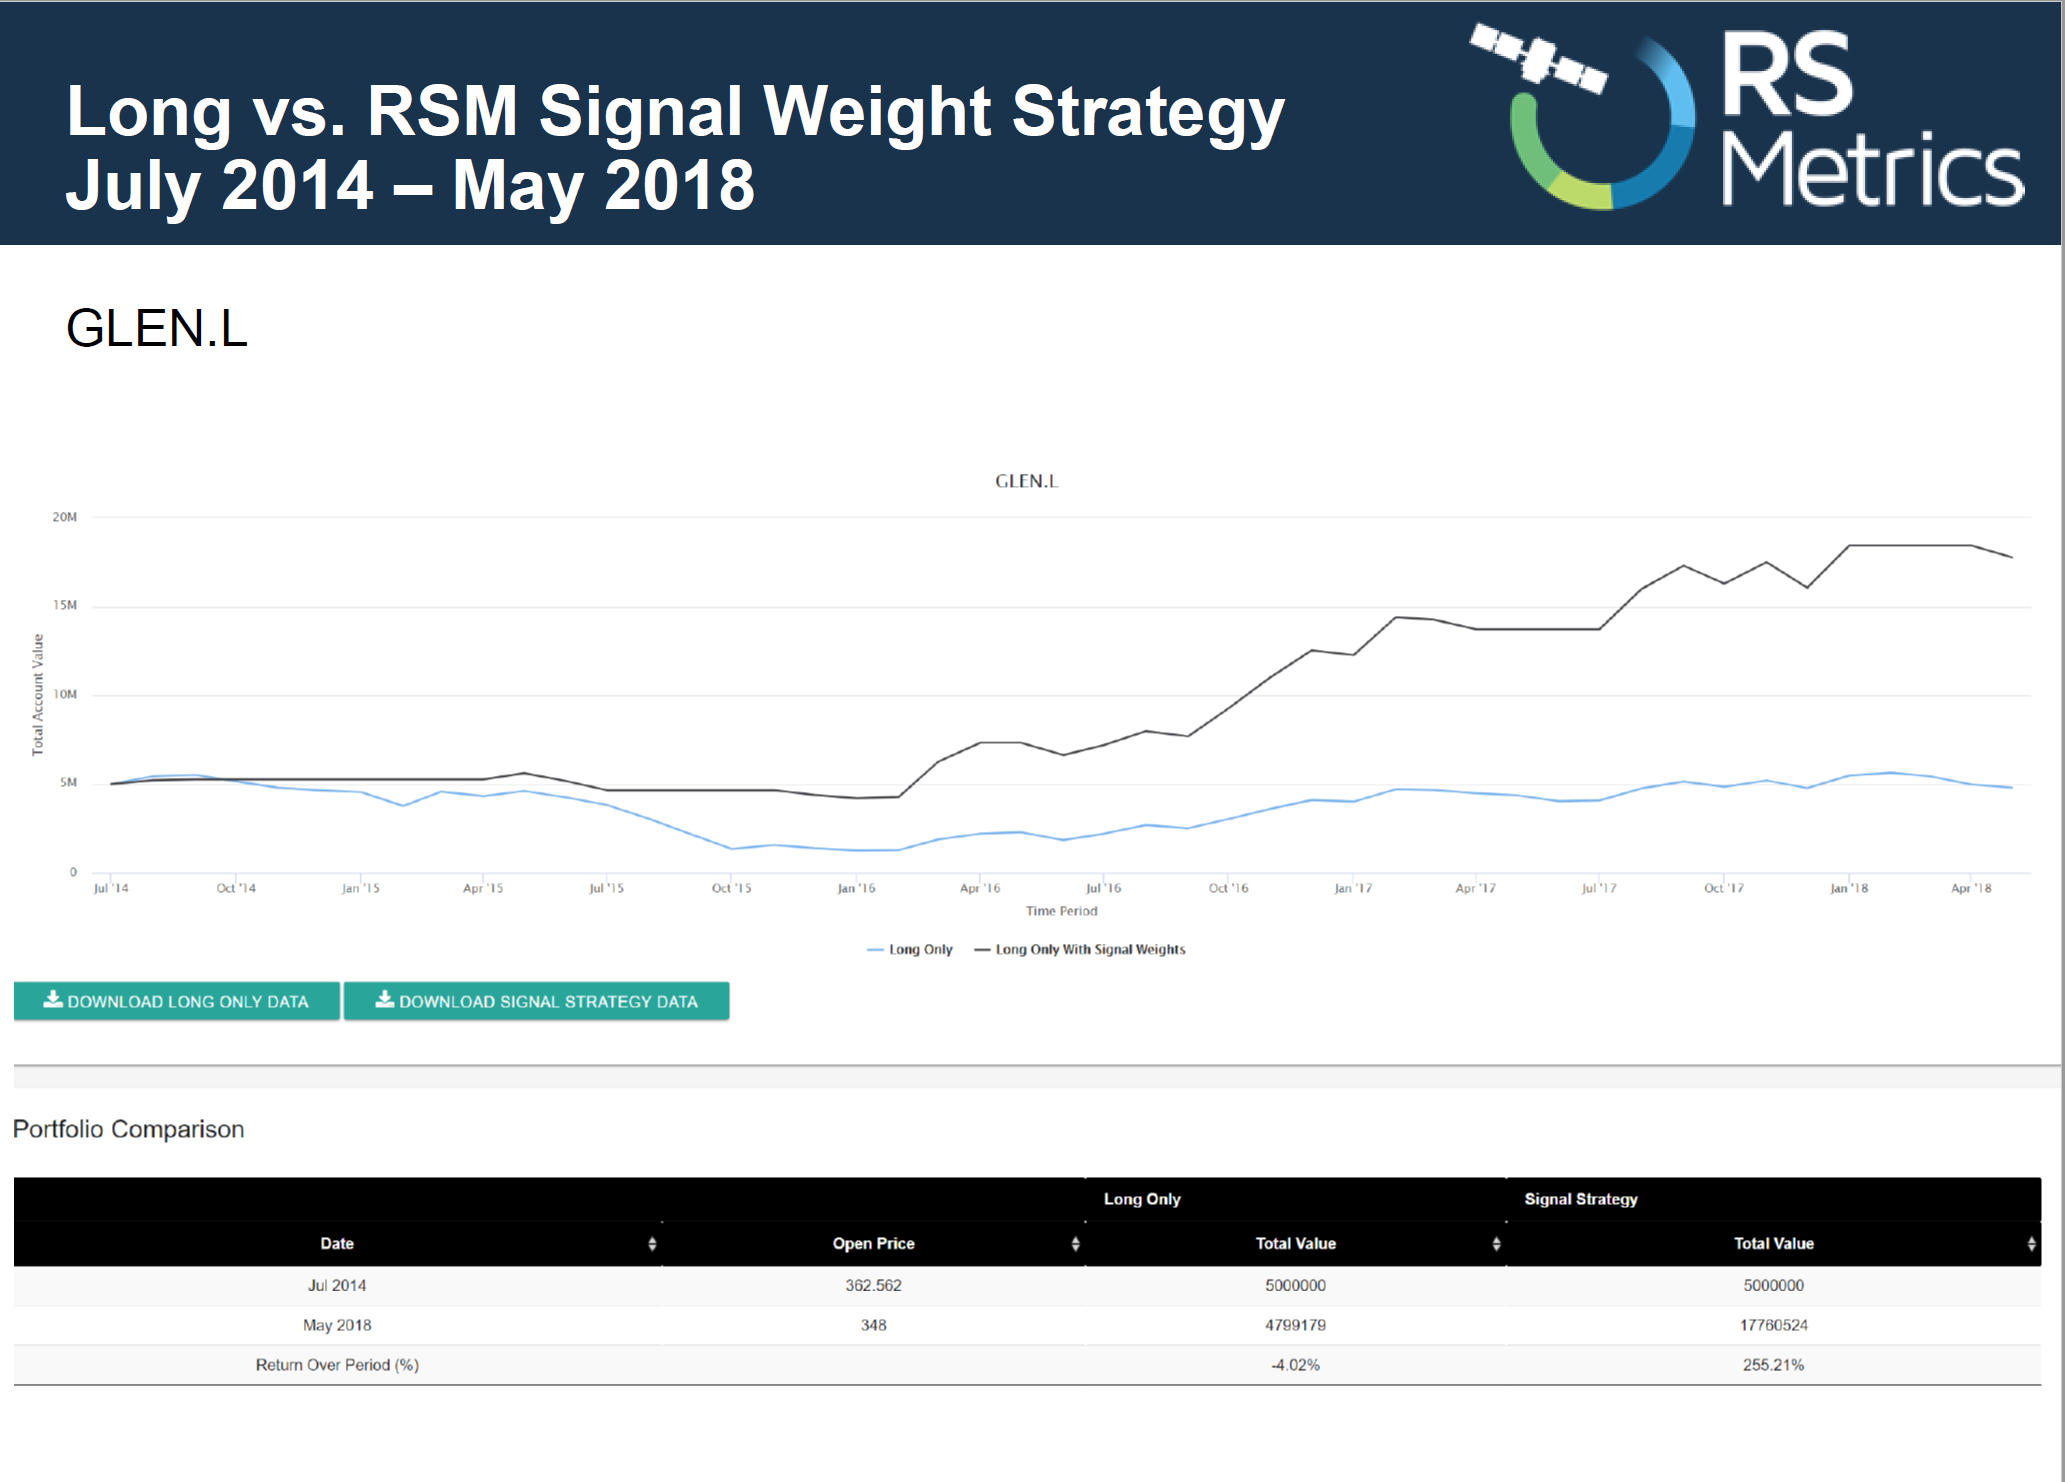
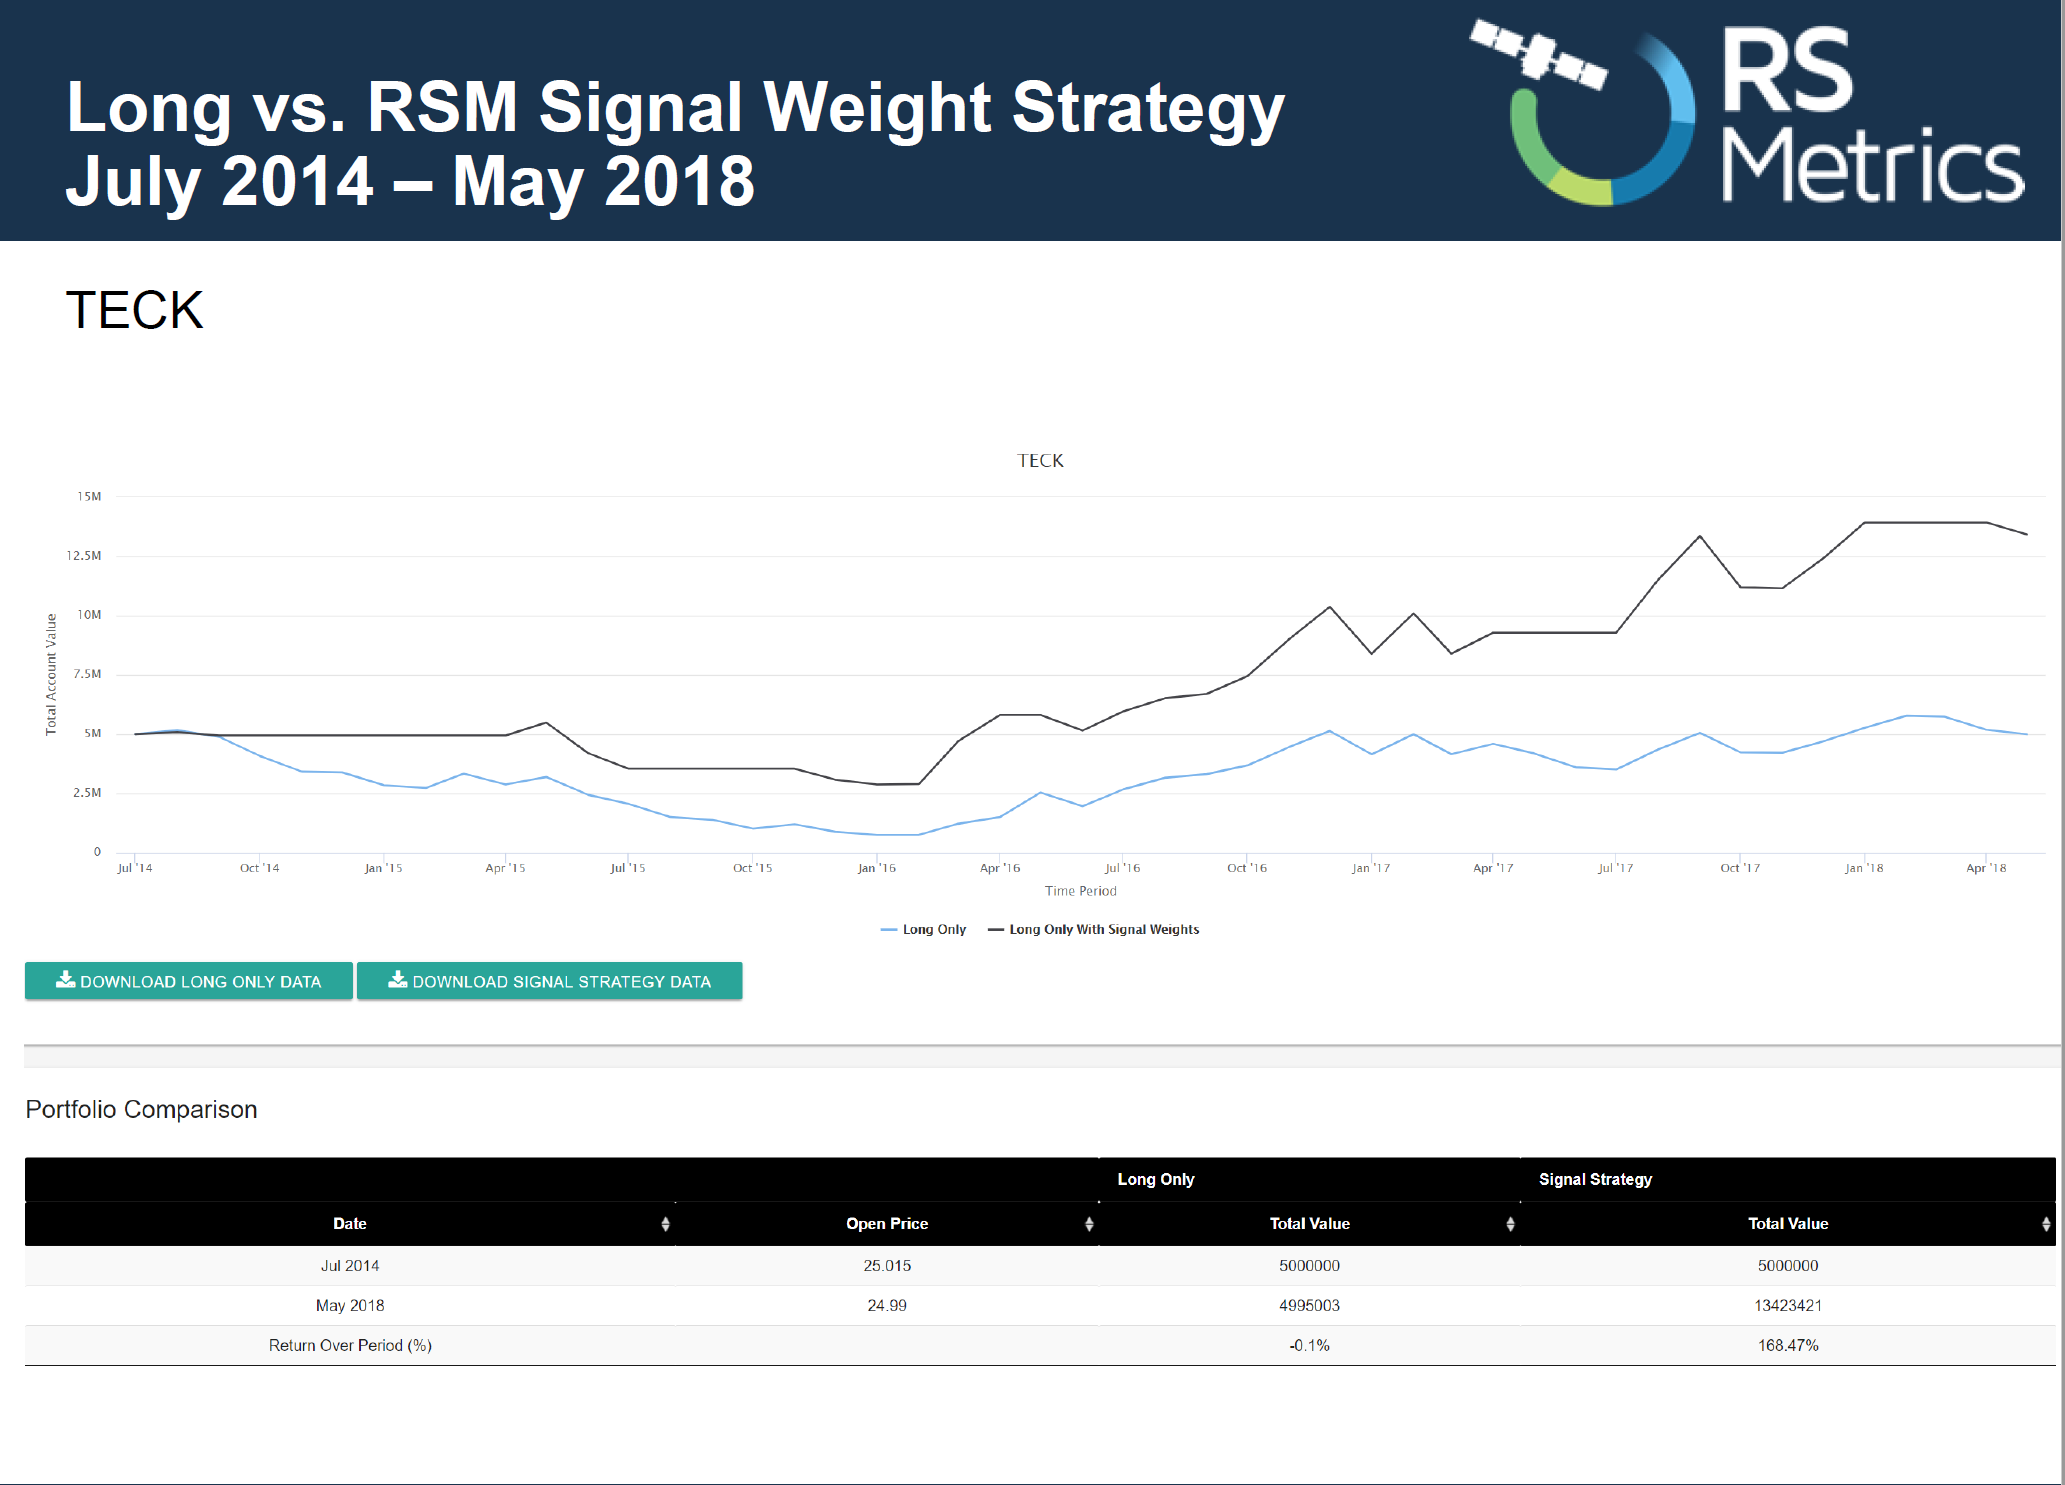
MetalSignals satellite imagery data predicts stock price for 100’s of equities with metals exposure. Here is a 2 min video showing Alpha from our signals for GLEN and TECK. Each returned +200% since 2014 vs. flat/negative from holding a long position.
With daily data sets, we are analyzing satellite imagery of over 250 global smelters and storage locations of copper, zinc, and aluminum while producing inventory data to provide insights into the supply/demand equation that drives much of the pricing of these commodities.
RS Metrics proprietary data is unavailable elsewhere and gives an objective view of global metal inventory. In essence, when we see a buildup of inventories across the globe, we often see the commodity price decline, and vice versa when we see inventories decline.
Insights on RS Metrics Data Process:
- RS Metrics data uses advanced AI and Machine learning tools, but also human oversight to ensure accuracy.
- Data history from 4.5 years back to January 2013
- Data can be delivered monthly, weekly or daily via FTP feeds or other preferred means of ingestion
Huge coverage universe:
- Large, liquid global equities with base metal exposure
- Companies that supply or consume these base metals
- Macro strategies
- ETFs
- Other tradable instruments
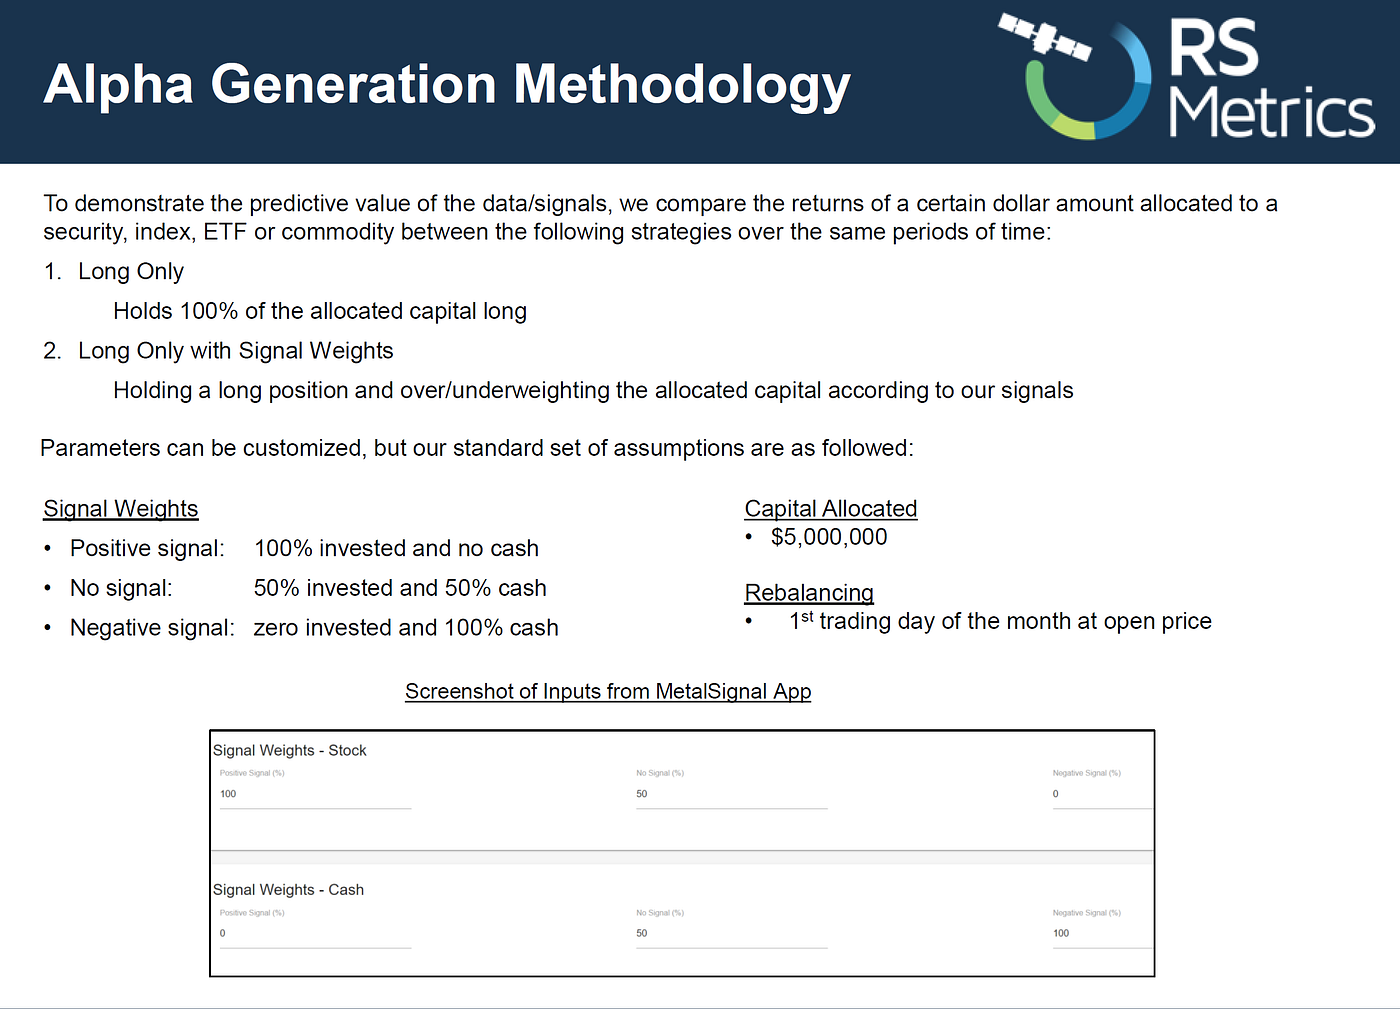
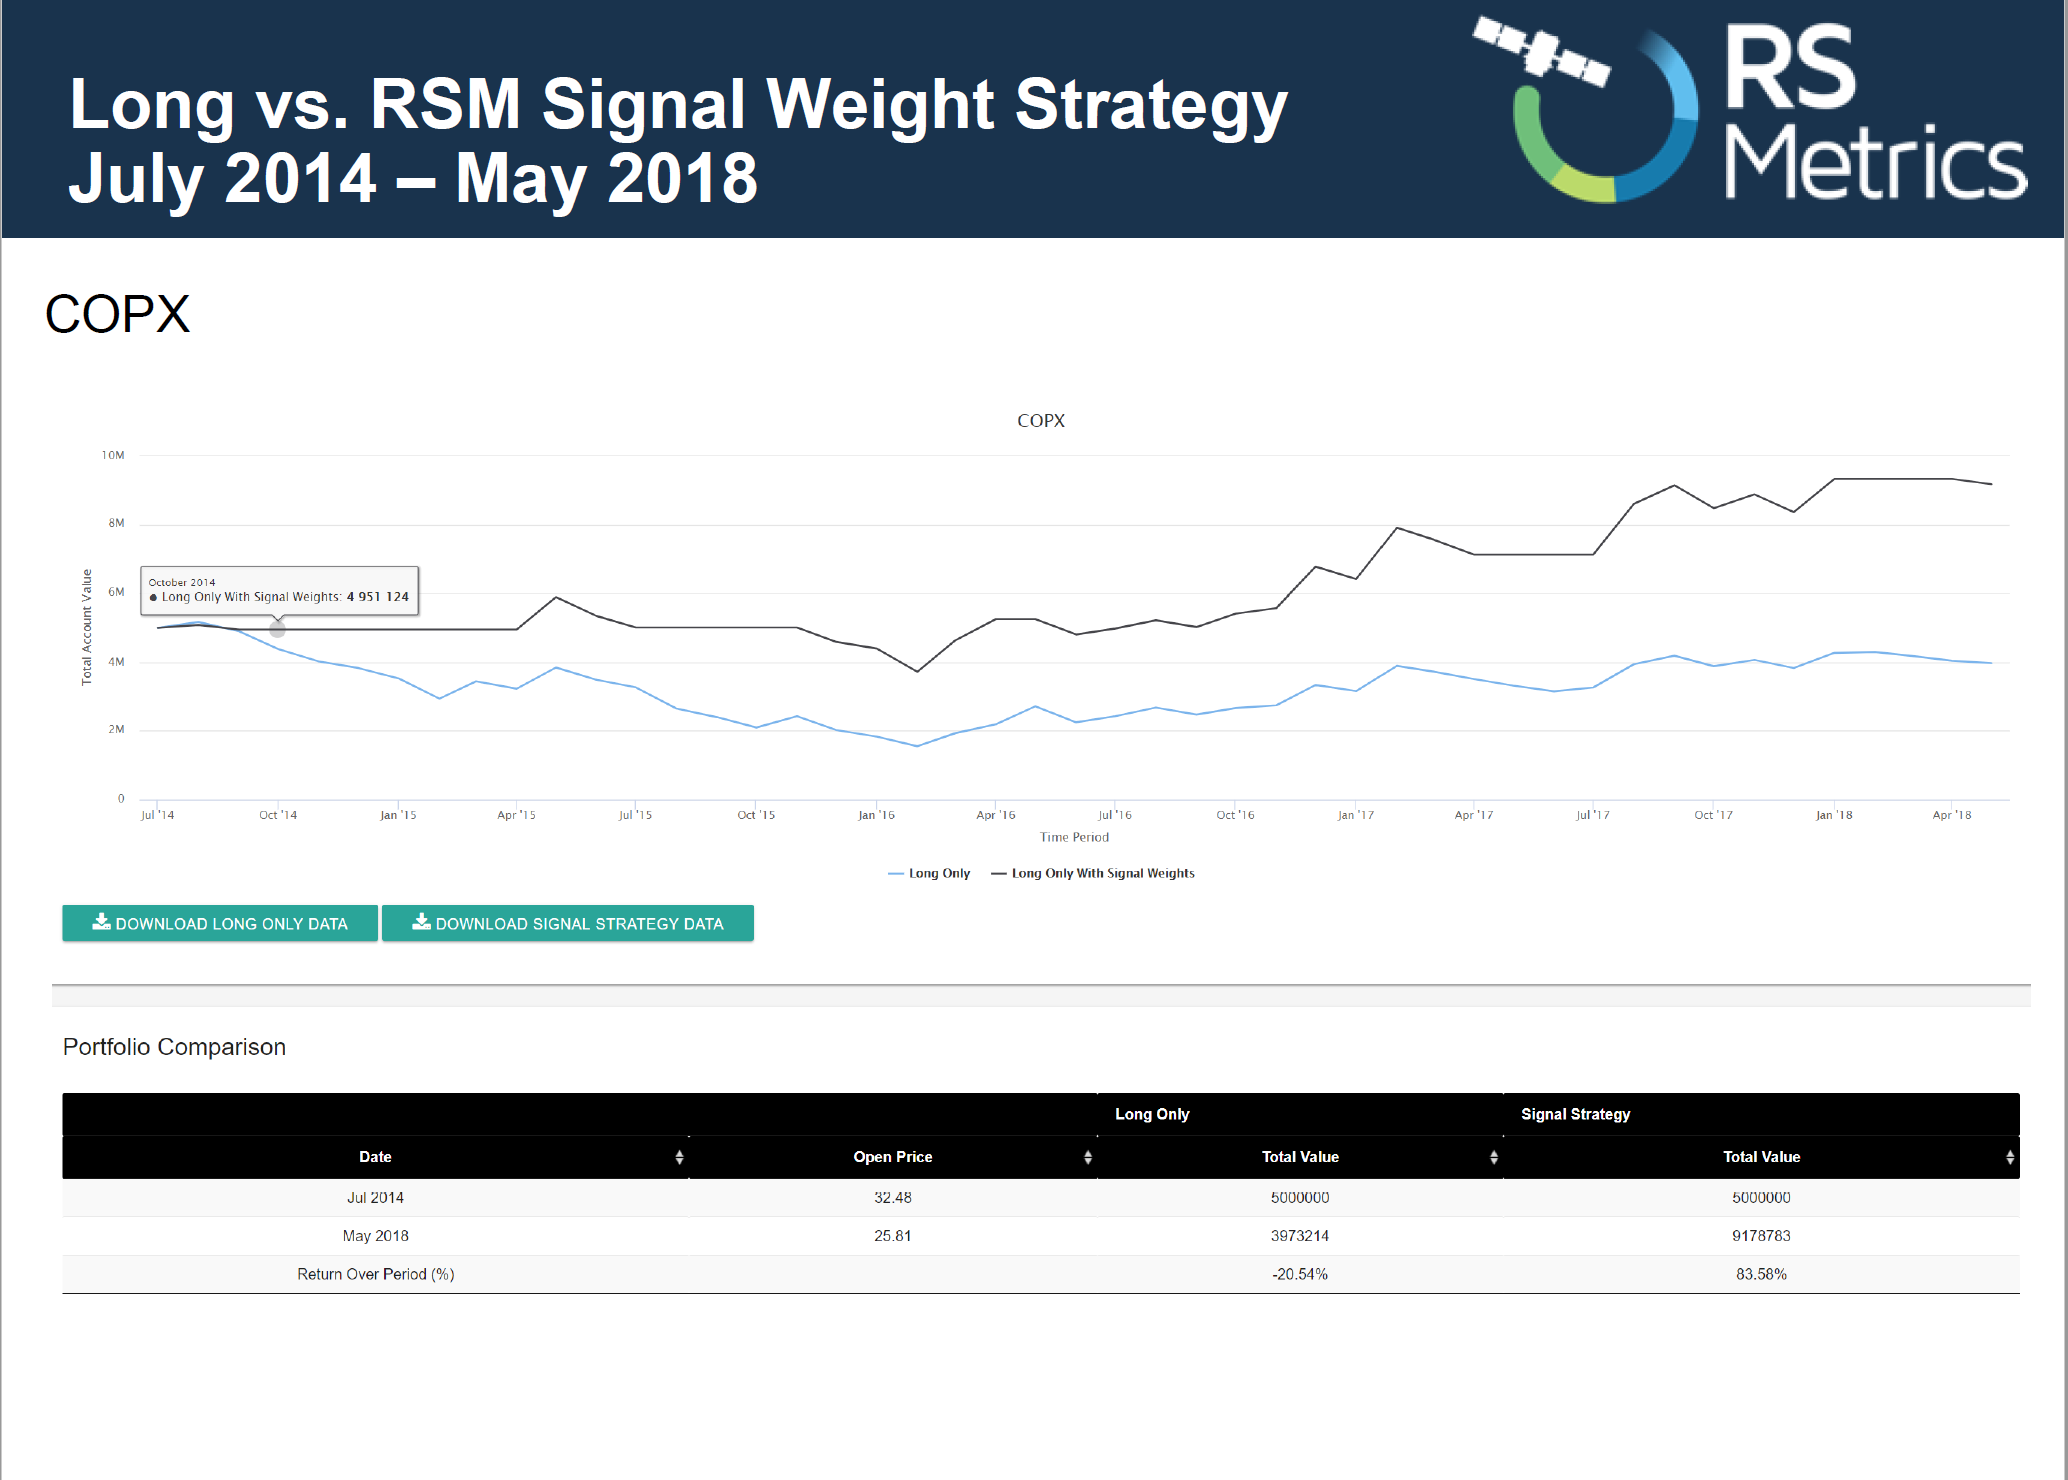
We are often asked, how can my clients generate alpha from this data? In attempting to answer that question, we have built a simple signal generation methodology and a tool. The out performance is quite compelling!
Below are some examples.
If this is interesting to you, we would love to walk you through a demo.
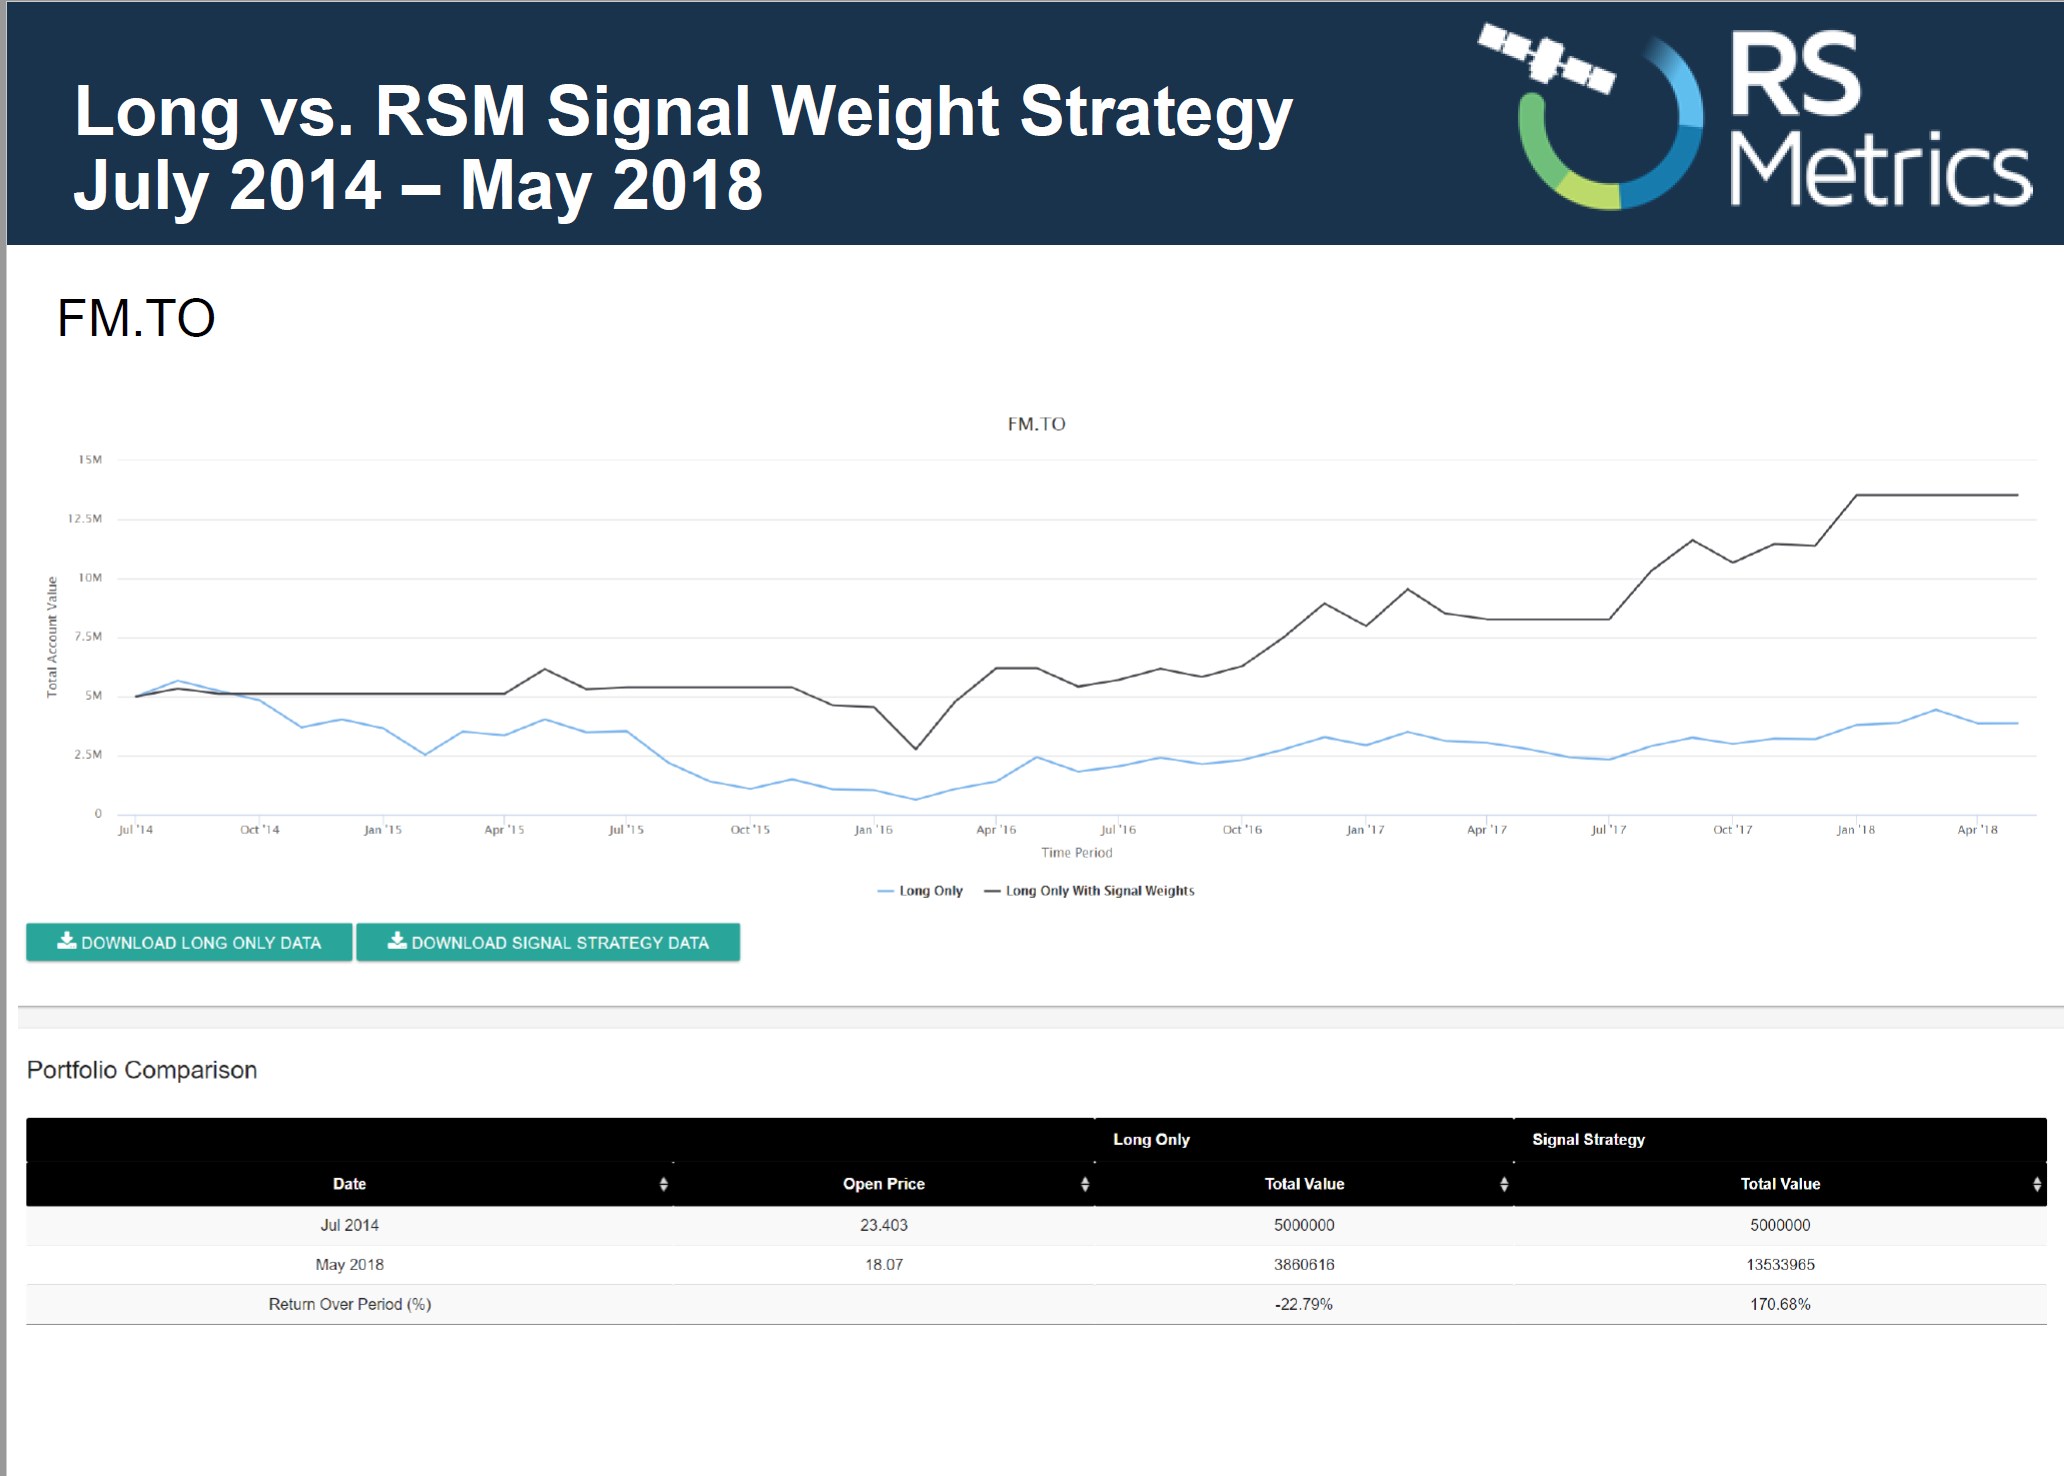
Click here for a demo: https://rsmetrics.com/trial/