Using a Parcel-Based Inventory to Quantify Wildfire Damage with Satellite and Aerial Imagery
Learn more about RS Metrics Custom Event Driven Monitoring Service here.
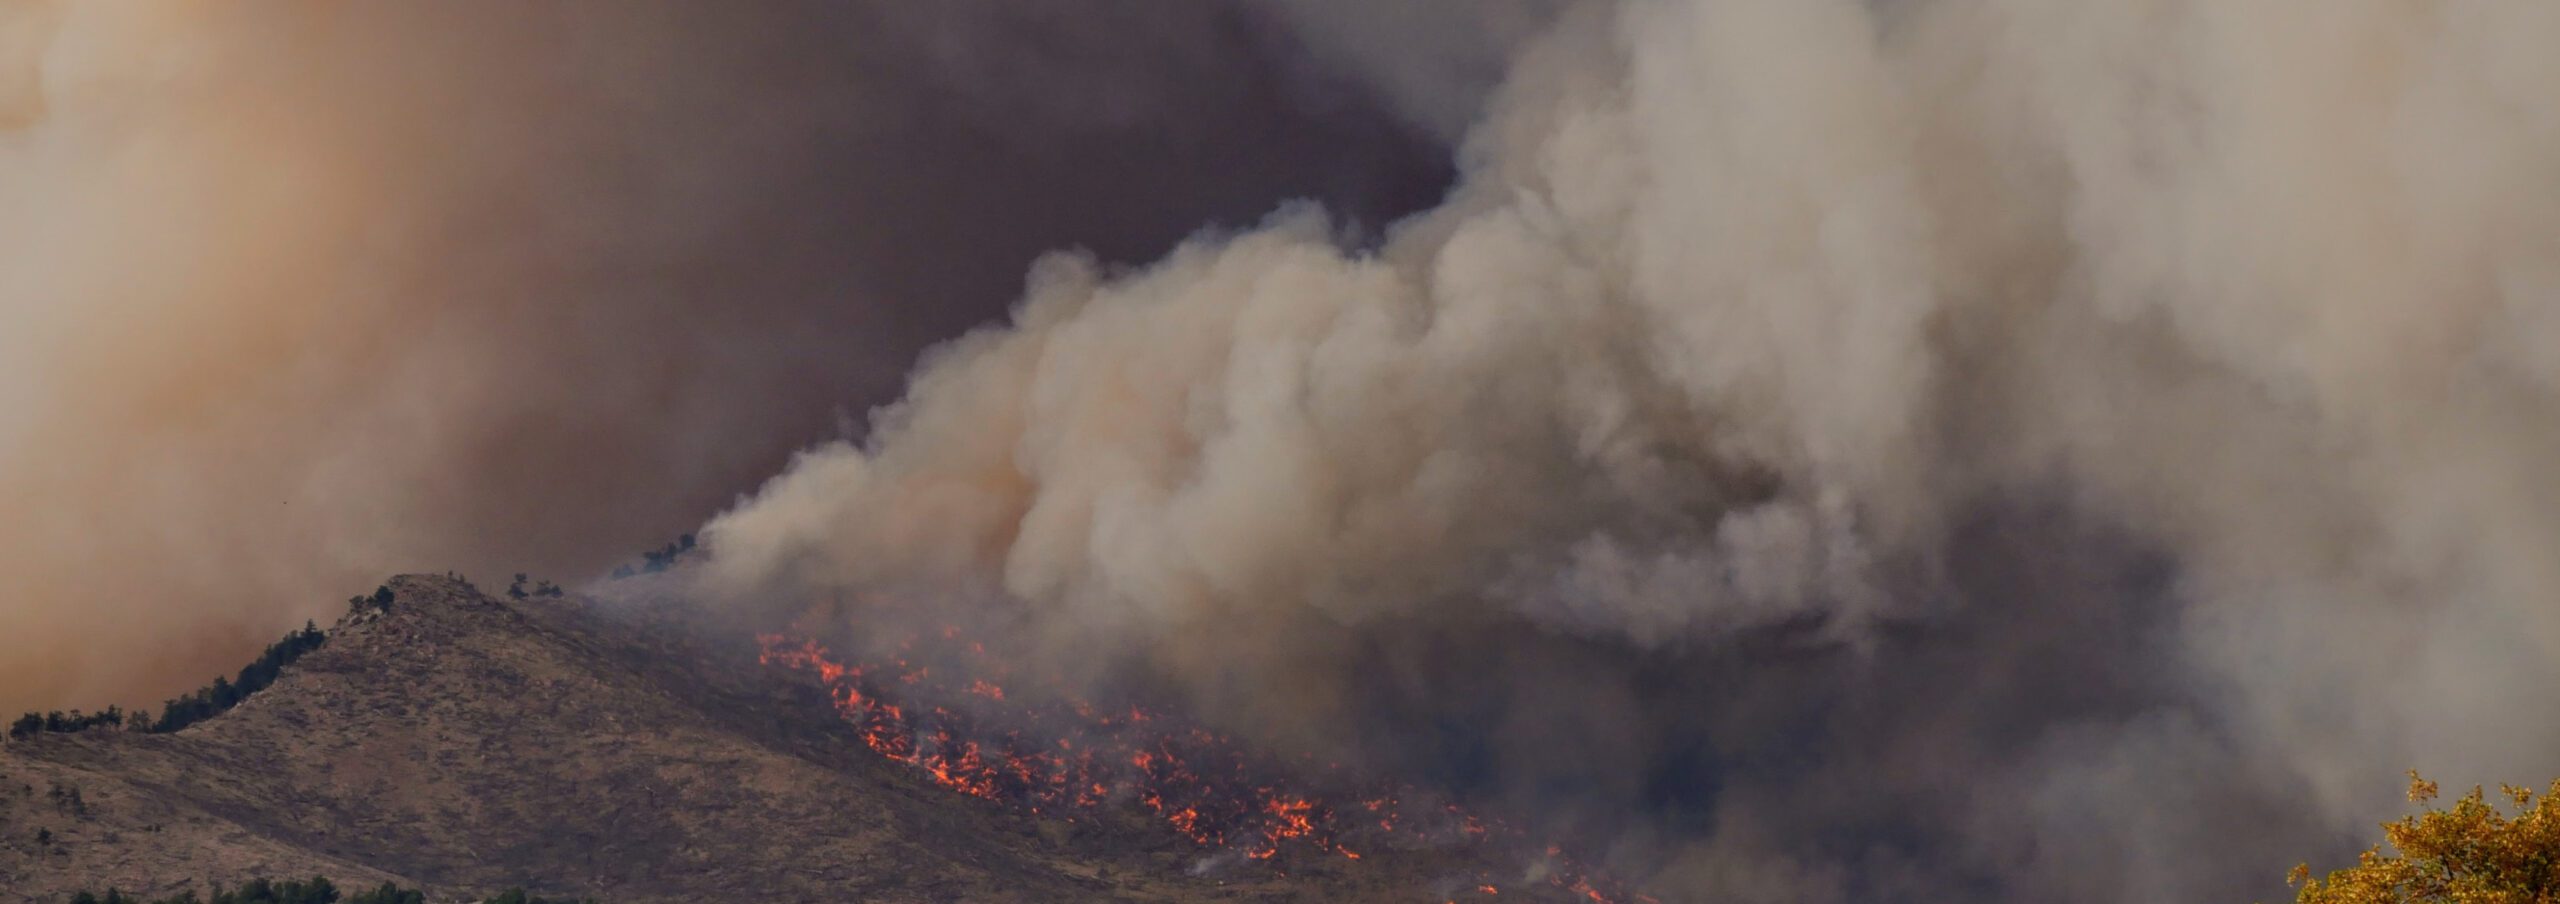
Through mid-March 2019, over 46,000 claims have been submitted against widespread damage caused by the three major California wildfires in 2018, including 13,000 claims for a complete and total loss. The total insured losses seem almost non-quantifiable as they approach $12.4 billion combined to-date.
RS Metrics used satellite imagery and other data to build a custom database that allows participants to accurately assess and quantify damage on a parcel-by-parcel basis using a pre-fire baseline and a post-fire damage assessment. This database can be used to accurately model risk using our methodology outlined below.
Background — Insurance Linked Securities
Almost three months into the Camp Fire recovery effort, the California Department of Insurance still held seminars and workshops in an auditorium at Chico State to help homeowners and small-business owners navigate their way through the claims process. Filing a claim is often the first step in getting ongoing help, whether that help comes from the insurance company or the government itself, since all outstanding risk must first be quantified.
Once an insurance claim is filed, the government is willing to step in with applications for FEMA or state and local disaster assistance. Only damages that aren’t covered by insurance can qualify for FEMA assistance.
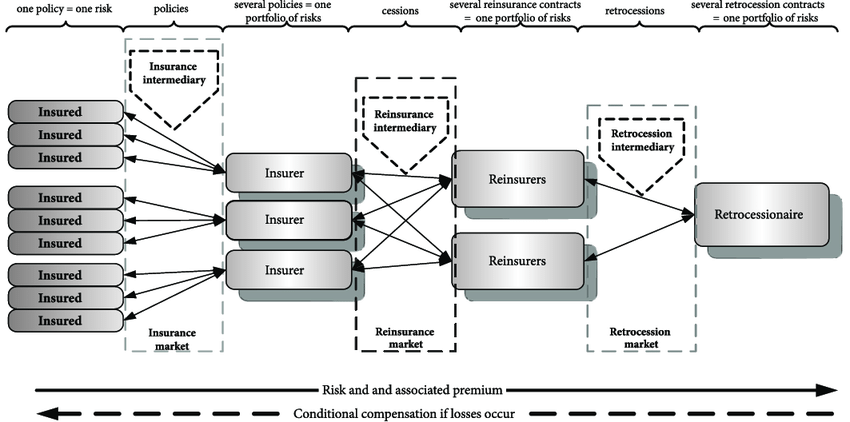
Quantifying damage is the job at hand for financial entities up and down the insurance spectrum. From local homeowners insurance agencies to national insurers, reinsurers, “retrocessionaires”, and risk-taking institutional investors such as hedge funds, all try to estimate the cost to underwrite these massive scale natural disasters. The graphic below shows some of the relationships and the complicated nature of insuring risk.
New and complex forms of Insurance Linked Securites (ILS) have gained popularity over recent years, in some ways mimicking the growth of the financial instruments that spiraled out of control during the 2008 financial crisis. One form of Insurance Linked Securities are catastrophe bonds, or “CAT Bonds”, which are widely used today and may become one of the principal vehicles for paying for wildfire losses going forward:
“The first CAT bonds were issued in 1997, giving insurers access to broader financial markets and offering institutional investors, such as hedge funds, pension funds, and mutual funds, the opportunity to earn an attractive return on investment uncorrelated with the returns of other financial market instruments in exchange for assuming catastrophe insurance risks.” — ChicagoFed.org
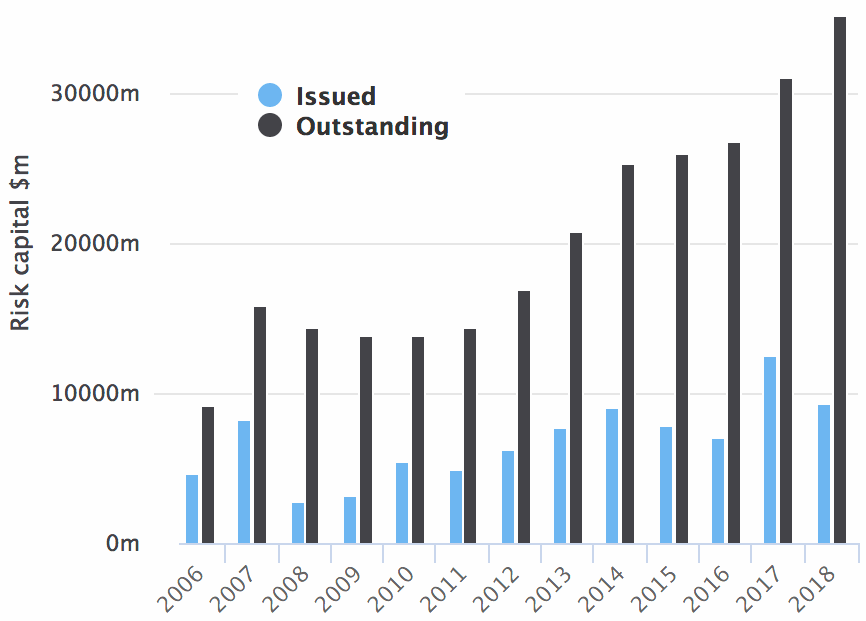
While CAT bond usage has been increasing significantly in recent years, those designed for wildfires are new phenomenon, and aren’t off to a promising start. The first one (Cal Phoenix Re Ltd. 2018-1) was sponsored by PG&E in 2018 and will likely be completely wiped out to the losses incurred by the Camp Fire. The size of the bond is $200 million, which will be dwarfed by the potential total liability in the tens of billions of dollars.
As the PG&E bond currently trades for pennies on the dollar, many institutional investors are exploring ways to take on the risk premium of the bond and searching for ways to perform proprietary high-resolution loss modeling on their own. In most cases, data on aggregate loss and the individual components of that loss is not shared between counter parties.
So how does a non-insurance institution begin to calculate a detailed damage assessment on their own? In this case, the modeling can be performed by a third party such as RS Metrics that possesses the team, geospatial technology, and relevant experience to build a detailed database of damaged structures on a parcel-by-parcel basis.

Source Data and Methodology
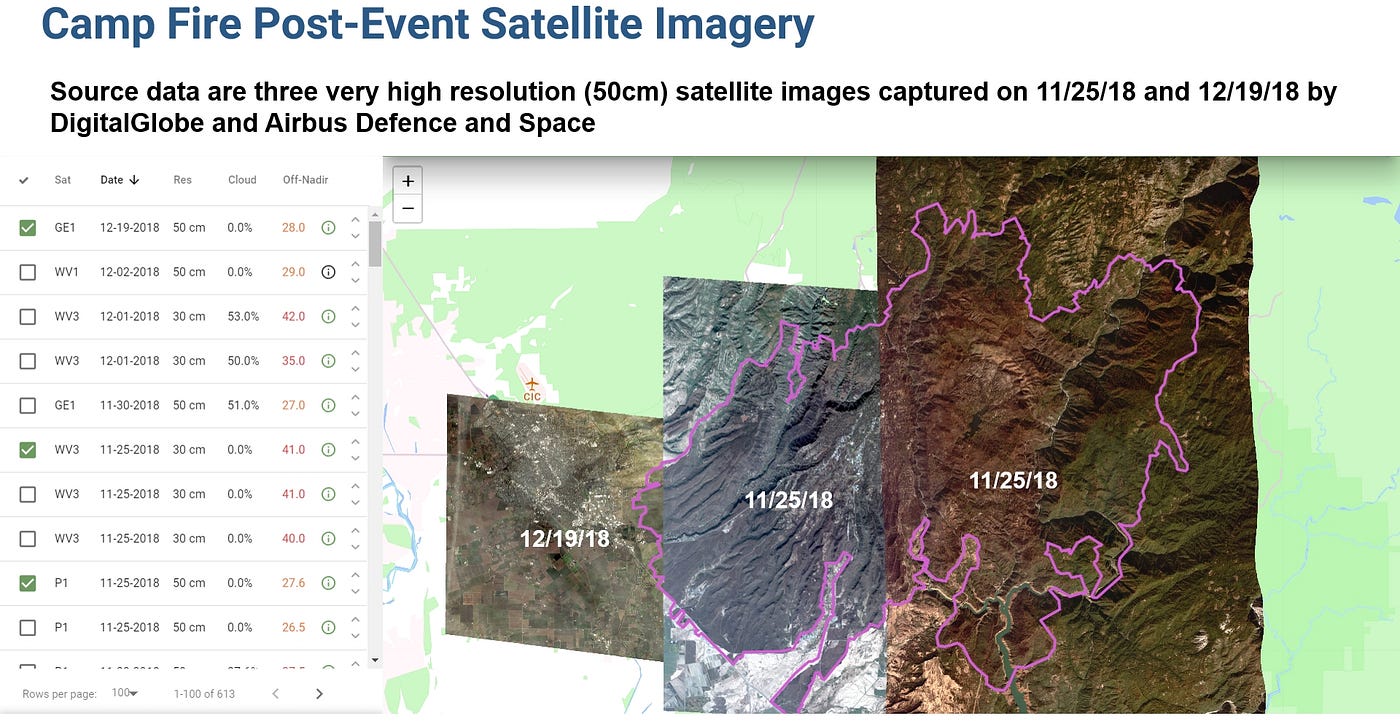
In order to build a baseline to track and measure fire related damage, RS Metrics acquired and analyzed 50 cm resolution satellite imagery collected after the fire was fully contained on Nov 25, 2018. The vast majority of the fire perimeter was captured with imagery from 11/25/18 with a small area on the west side from 12/19/18.
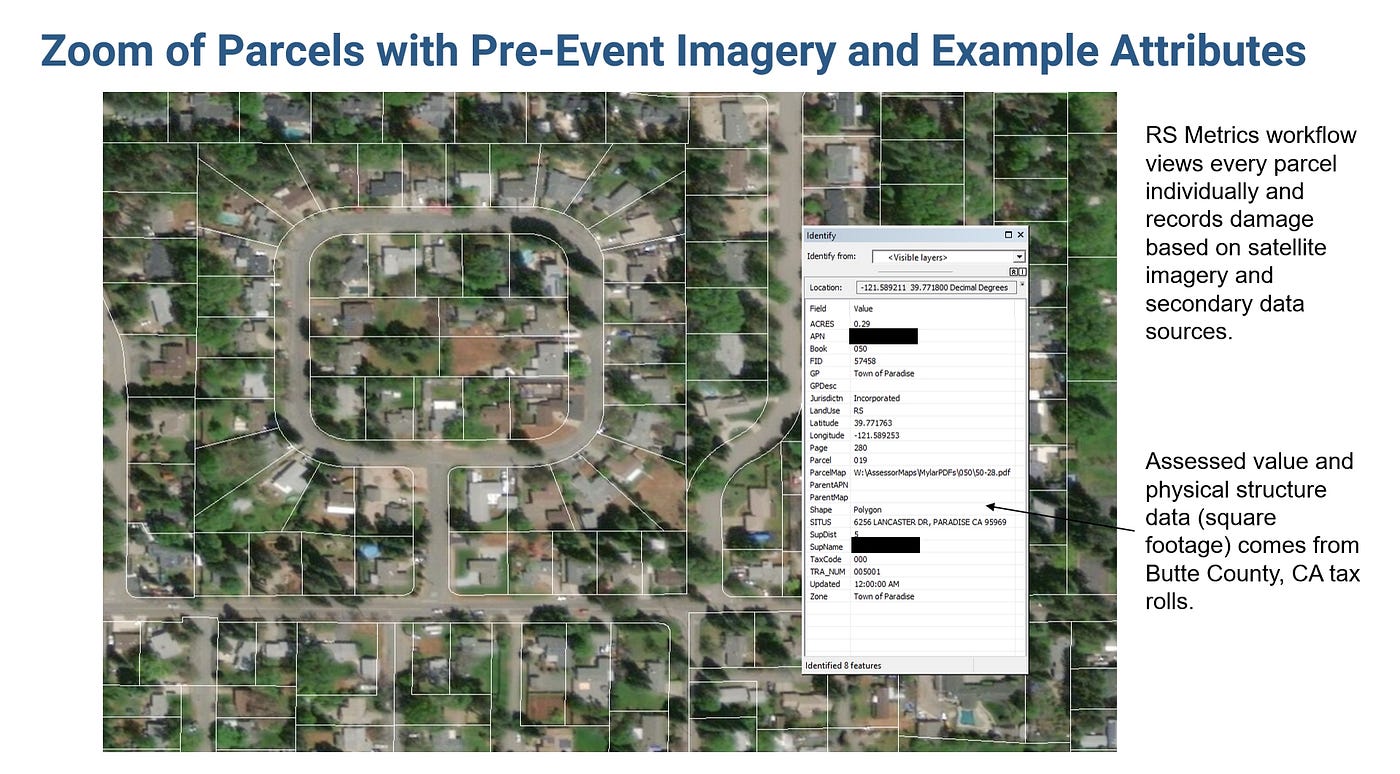
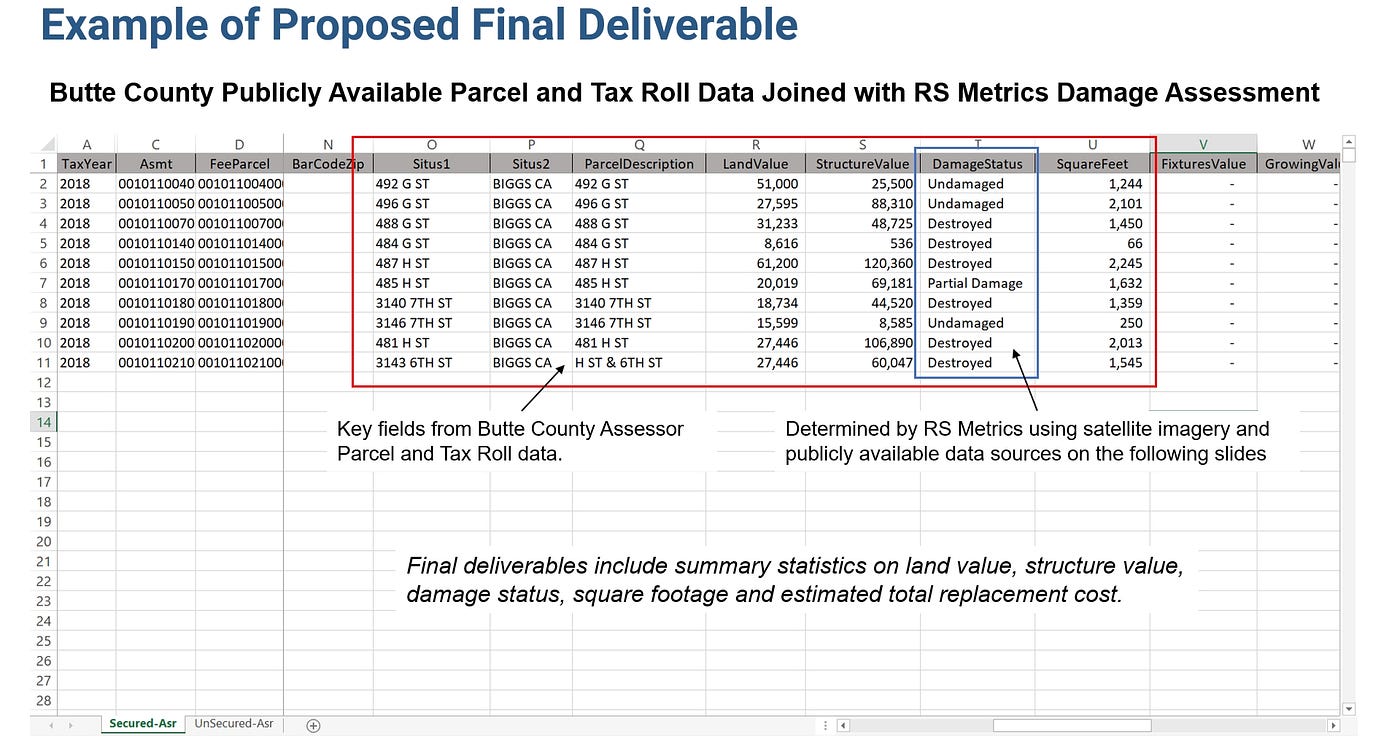
In addition to satellite imagery, parcel and tax roll data were sourced from the Butte County, CA Assessors Office. Metrics collected included square footage and assessed land and structure value of each home prior to it being destroyed. Approximately 18,265 parcels fell within the final fire perimeter and were therefore subject to analysis.
The process for generating the damage database is as follows:
- Determine the fire perimeter including specific municipalities or any residential properties that intersect a buffer of the fire boundaries.
- Acquire imagery as near as possible on or after Nov 25, 2018, including satellite imagery and aerial imagery available from the State of California or Butte County, CA.
- Obtain and purchase parcel and tax roll data from Butte County, CA with square footage, assessed value, address, and other information as needed.
- Determine the number of parcels required for analysis through a geospatial intersection.
- Capture the following information for each parcel: 1) Street Address, 2) level of destruction at each property, coded as destroyed, partial damage, or undamaged, 3) Square footage of the parcel, property, and structure, 5) Assessed value of the land, parcel, property , and structure.
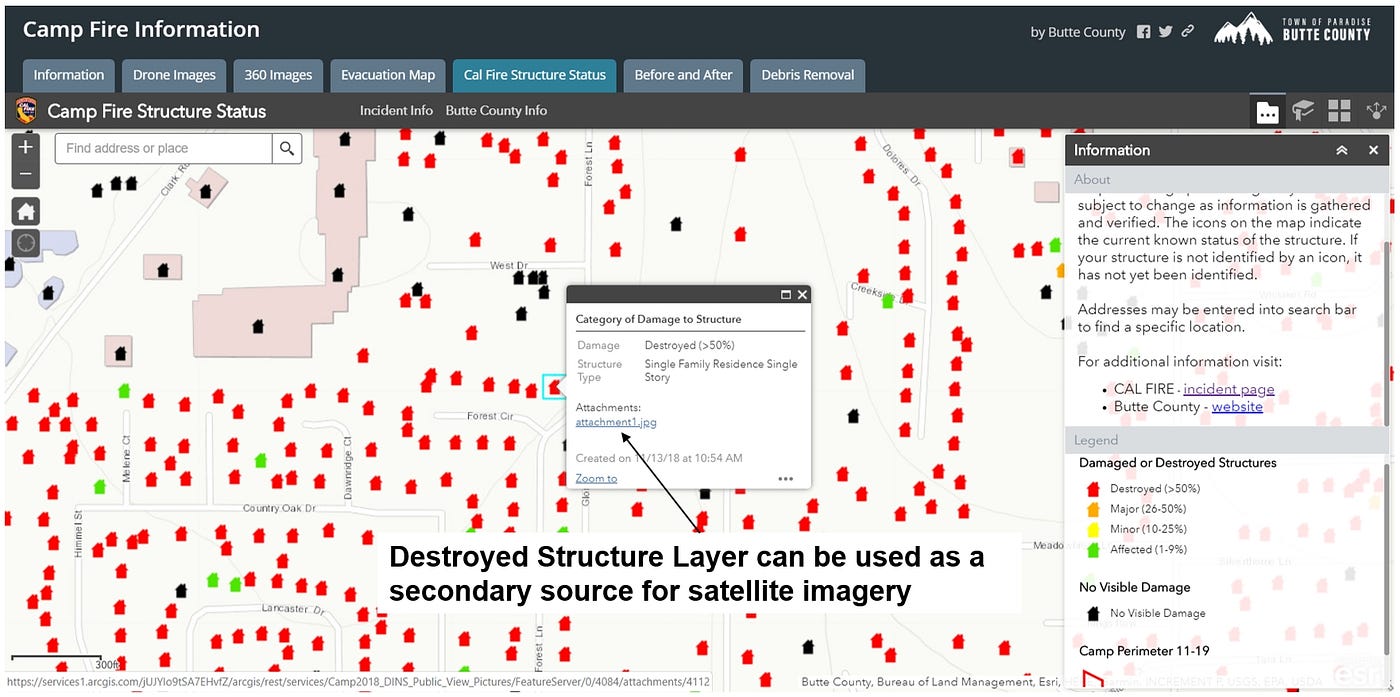
Data from public sources can be used to validate information collected through satellite imagery. Destroyed structure layers, addresses, aerial imagery, and ground level imagery can all be incorporated into a ensemble-based model.
Ground level photos are used to visually verify structures that are obscured or not otherwise verifiable in satellite or aerial imagery. Distressing photos like these were captured by emergency authorities and contractors and become invaluable records for documenting the extent of the disaster in the years to come.

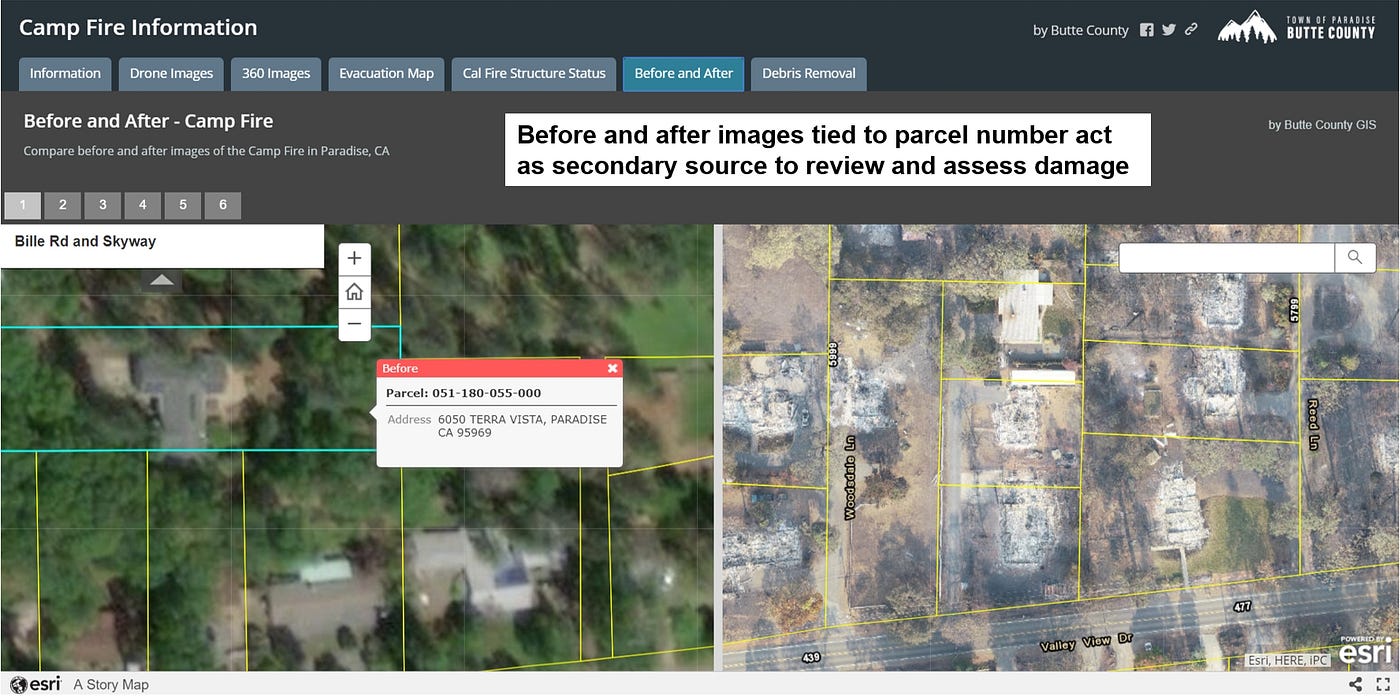
Additional tools are made available from government officials in Butte County and Cal Fire. In this instance before and after aerial imagery can be used as another secondary source to verify ground-level damage. RS Metrics uses “human-in-the-loop” machine learning processes to capture initial change detection features from before and after satellite imagery followed by human validation on a parcel-by-parcel basis.
Summary and Conclusion
Building a custom database allows participants of the CAT bond market to accurately assess and quantify damage on a parcel-by-parcel basis. This database can be used as a baseline to model risks associated with catastrophe bonds and Insurance Linked Securities overall. As these tools become more widely used not just for wildfire, but for any extraordinary event, sufficient levels of risk can be distributed through the entire financial system.
To learn more about RS Metrics please visit our website or contact us directly at info@rsmetrics.com to learn about our custom event monitoring service. You can also follow recent developments on Twitter and LinkedIn.
Written by Alex Diamond


