
Forecasting directional price and inventory movements for aluminum, copper, and zinc
MetalSignals from RS Metrics uses satellite imagery to track the amount of metal stored outside nearly 400 major global smelters and storage facilities. The processed data is then used to identify periods of significant change that are predictive of Aluminum, Copper, and Zinc price and inventory movements on the London Metals Exchange (LME).

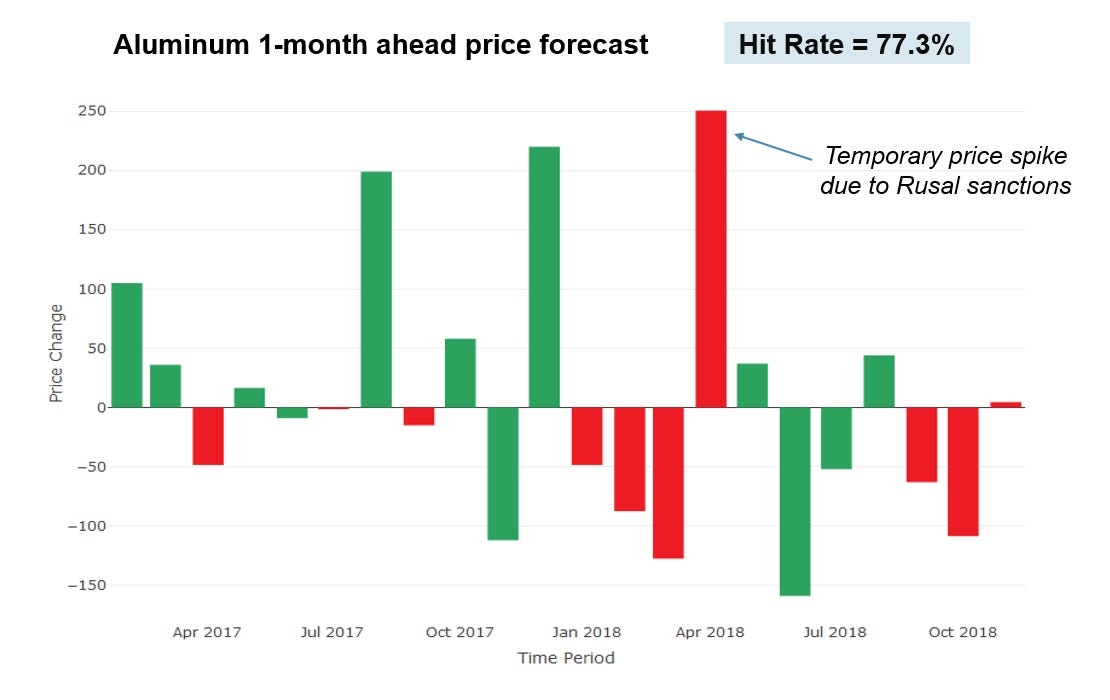
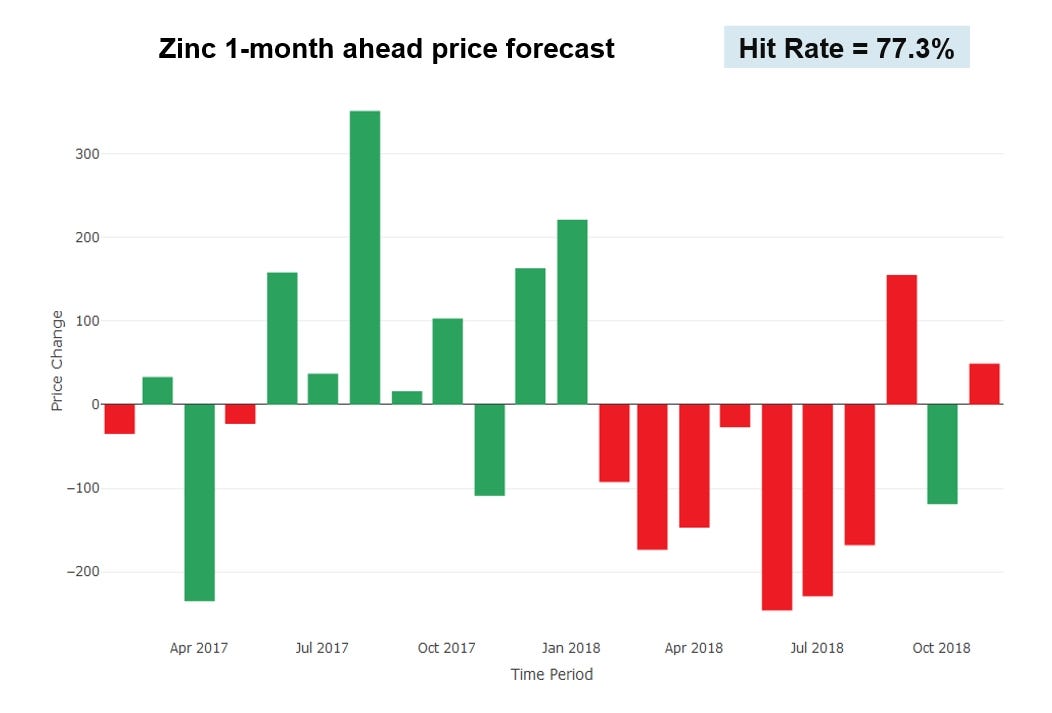
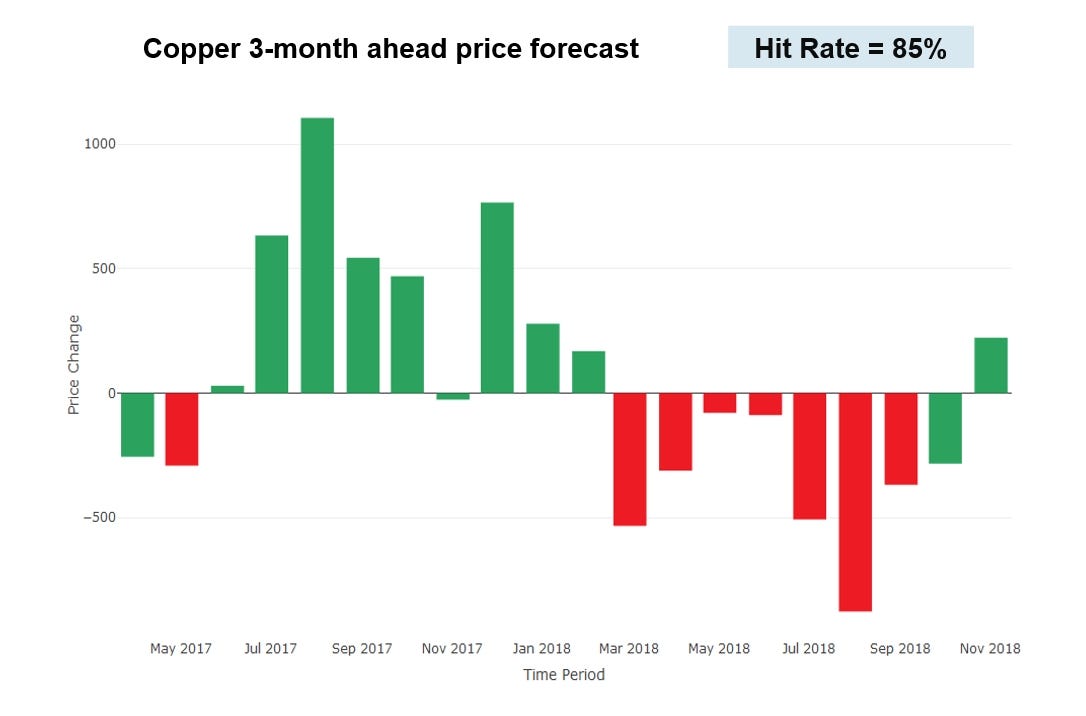
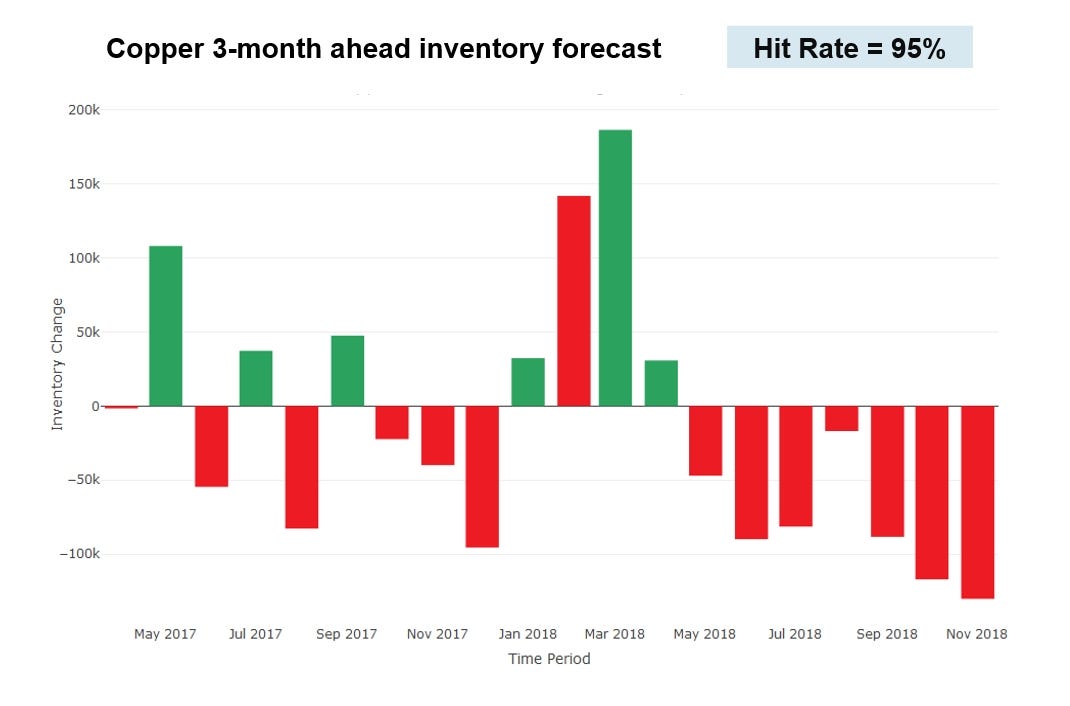
The charts below present “hit rates” for 1 and 3 month ahead directional price and inventory forecasts. Each bar represents a monthly forecast, where the color of the bar indicates the forecasted direction (green = positive, red = negative), and the direction and magnitude of the bar represent what actually happened. Each correctly predicted direction counts toward the overall hit rate.

Methodology
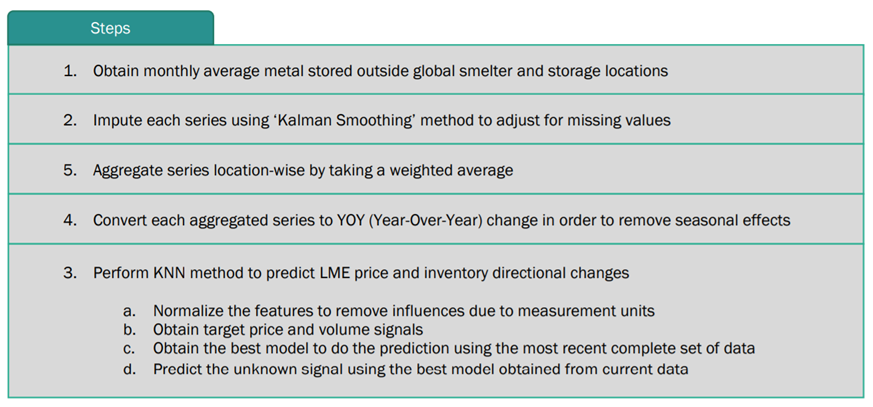
The methodology used to generate the 1 and 3 month ahead directional change forecasts is based on K-Nearest Neighbors classification. This is a non-parametric method that uses a set of features and class labels of a target variable from training data as input to predict the class label of an unknown data point with known feature values.
More information on our forecast methodology can be found in our Aluminum White Paper and Copper White Paper.

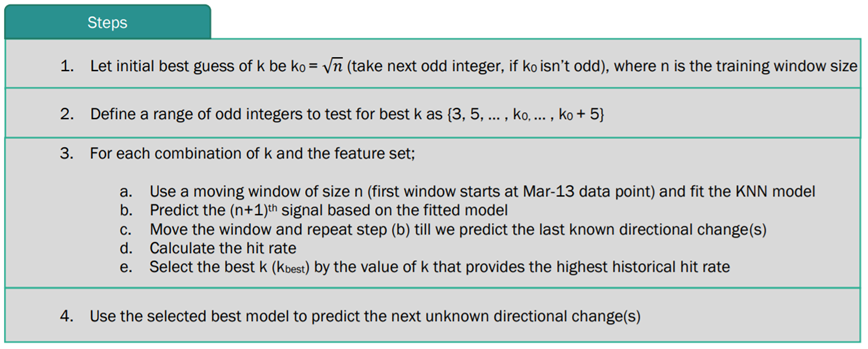
KNN Model Selection
As we continue to add more locations and more metal data each month, the KNN model we use to make forecasts is adjusted each month in order to take into account the improved dataset and to maximize the hit rate. The following procedure is followed in order to select the best KNN model to make forecasts each month.
Price Hit Rates
1-MONTH FORWARD DIRECTIONAL FORECASTS

3-MONTHS FORWARD DIRECTIONAL FORECASTS


Inventory Hit Rates
1-MONTH FORWARD DIRECTIONAL FORECASTS


3-MONTH FORWARD DIRECTIONAL FORECASTS


The analysis presented above focuses only on predicting LME Aluminum price and inventory changes using RS Metrics’ metal data. However, the value of this data extends well beyond and is even predictive of commodity related ETF prices, price for metals-related equities, currencies, interest rates, and more.
As previously noted, the current results are purely based on RS Metrics’ metal data and to obtain better forecasts, it is recommended that you use this data along with other consumption and demand information.
To learn more about MetalSignals please visit our overview page or contact us directly at info@rsmetrics.com to learn about introductory pricing. You can also follow recent developments on Twitter and LinkedIn and purchase a monthly subscription here.


